|
Rossmann Store Sales is a Kaggle Competition. You can find information about this dataset and download it here : https://www.kaggle.com/c/rossmann-store-sales/data
The purpose of this competition was to predict sales using store, promotion, and competitor data. Here is some information of this competition from the Kaggle Website: "Rossmann operates over 3,000 drug stores in 7 European countries. Currently, Rossmann store managers are tasked with predicting their daily sales for up to six weeks in advance. Store sales are influenced by many factors, including promotions, competition, school and state holidays, seasonality, and locality. With thousands of individual managers predicting sales based on their unique circumstances, the accuracy of results can be quite varied.In their first Kaggle competition, Rossmann is challenging you to predict 6 weeks of daily sales for 1,115 stores located across Germany. Reliable sales forecasts enable store managers to create effective staff schedules that increase productivity and motivation. By helping Rossmann create a robust prediction model, you will help store managers stay focused on what’s most important to them: their customers and their teams! " 1. Understand this dataset There are four csv files in this dataset: store.csv, train.csv, test.csv and sample_submission.csv. In the first step, we just need to look into store and train files. Store file contains the supplemental information about stores. Train file contains the historical data including Sales. ## Load store file store <- read.csv("store.csv", header = TRUE, stringsAsFactors = FALSE) ## Get the dimension of store file dim(store) ## [1] 1115 10 ## Get the summary of store file summary(store) ## Store StoreType Assortment ## Min. : 1.0 Length:1115 Length:1115 ## 1st Qu.: 279.5 Class :character Class :character ## Median : 558.0 Mode :character Mode :character ## Mean : 558.0 ## 3rd Qu.: 836.5 ## Max. :1115.0 ## ## CompetitionDistance CompetitionOpenSinceMonth CompetitionOpenSinceYear ## Min. : 20.0 Min. : 1.000 Min. :1900 ## 1st Qu.: 717.5 1st Qu.: 4.000 1st Qu.:2006 ## Median : 2325.0 Median : 8.000 Median :2010 ## Mean : 5404.9 Mean : 7.225 Mean :2009 ## 3rd Qu.: 6882.5 3rd Qu.:10.000 3rd Qu.:2013 ## Max. :75860.0 Max. :12.000 Max. :2015 ## NA's :3 NA's :354 NA's :354 ## Promo2 Promo2SinceWeek Promo2SinceYear PromoInterval ## Min. :0.0000 Min. : 1.0 Min. :2009 Length:1115 ## 1st Qu.:0.0000 1st Qu.:13.0 1st Qu.:2011 Class :character ## Median :1.0000 Median :22.0 Median :2012 Mode :character ## Mean :0.5121 Mean :23.6 Mean :2012 ## 3rd Qu.:1.0000 3rd Qu.:37.0 3rd Qu.:2013 ## Max. :1.0000 Max. :50.0 Max. :2015 ## NA's :544 NA's :544
The store file has 1,115 observations and 10 fields.
From competition website we can find data fields descriptions:
## Load the train file
train <- read.csv("train.csv", header = TRUE, stringsAsFactors = FALSE)
## Get the dimension of train file
dim(train)
## [1] 1017209 9 ## Get the summary of train file summary(train) ## Store DayOfWeek Date Sales ## Min. : 1.0 Min. :1.000 Length:1017209 Min. : 0 ## 1st Qu.: 280.0 1st Qu.:2.000 Class :character 1st Qu.: 3727 ## Median : 558.0 Median :4.000 Mode :character Median : 5744 ## Mean : 558.4 Mean :3.998 Mean : 5774 ## 3rd Qu.: 838.0 3rd Qu.:6.000 3rd Qu.: 7856 ## Max. :1115.0 Max. :7.000 Max. :41551 ## Customers Open Promo StateHoliday ## Min. : 0.0 Min. :0.0000 Min. :0.0000 Length:1017209 ## 1st Qu.: 405.0 1st Qu.:1.0000 1st Qu.:0.0000 Class :character ## Median : 609.0 Median :1.0000 Median :0.0000 Mode :character ## Mean : 633.1 Mean :0.8301 Mean :0.3815 ## 3rd Qu.: 837.0 3rd Qu.:1.0000 3rd Qu.:1.0000 ## Max. :7388.0 Max. :1.0000 Max. :1.0000 ## SchoolHoliday ## Min. :0.0000 ## 1st Qu.:0.0000 ## Median :0.0000 ## Mean :0.1786 ## 3rd Qu.:0.0000 ## Max. :1.0000
In the train file, there are 1,017,209 observations and 9 data fields.
2. Exploration and Visualization 2.1 Load Data in Tableau Choose Text File -> Select train.csv -> Drag store.csv to join with train.csv -> Edit the join type into "Left join". 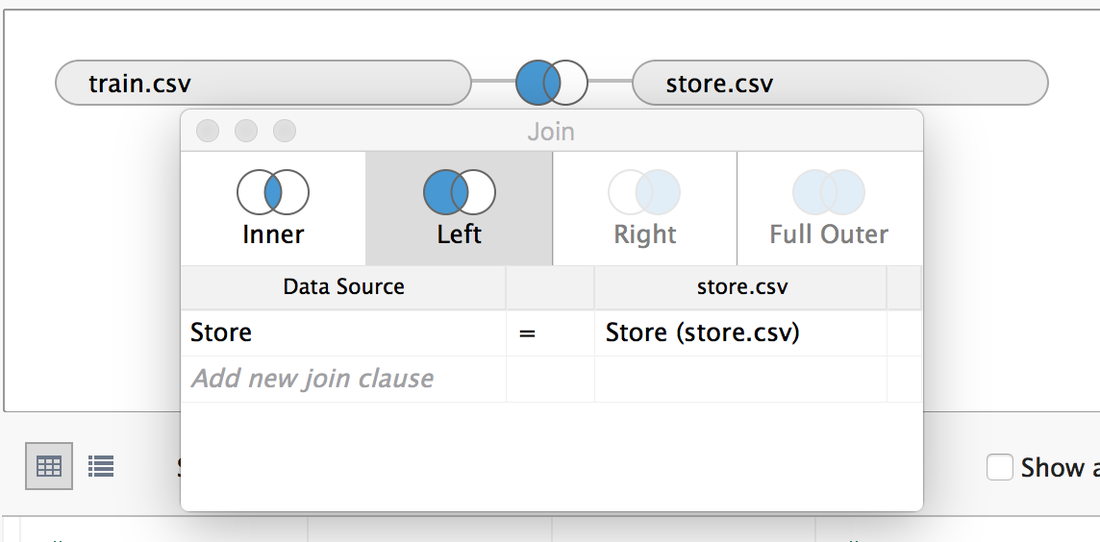
2.2 Ask Questions and Answer them Q1: Which Store has the highest Sales? A1: According to the Store file, there are 111,5 stores. We can use bar chart to show. (Sum the sales and sort by descending order, keep only top 10 stores). The top 1 is store 262. 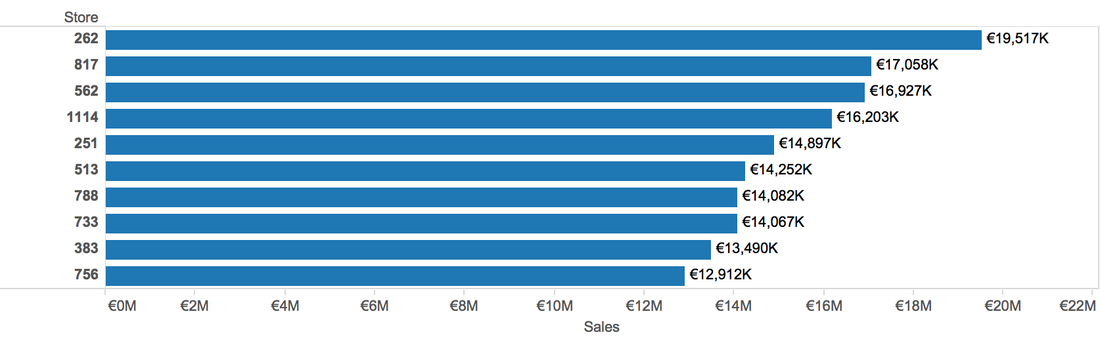
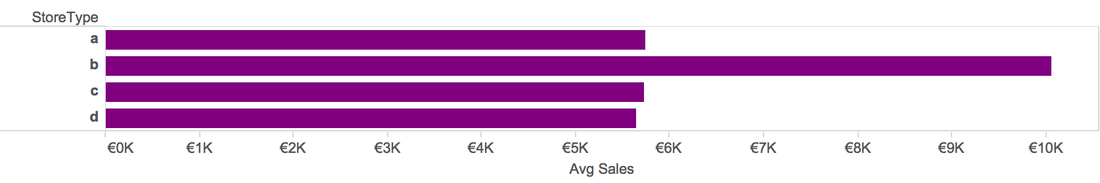
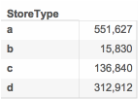
Q2: Which Store Type has the highest Sales
A2: Type a has the highest sum Sales, but type b has the highest average Sales, the reason is in near 1 million dataset, there are only around 15 thousand observations that belong to type b. 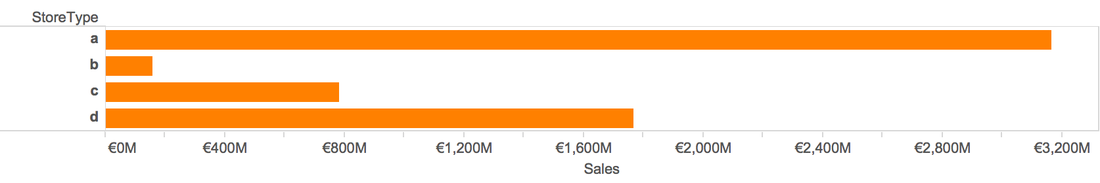
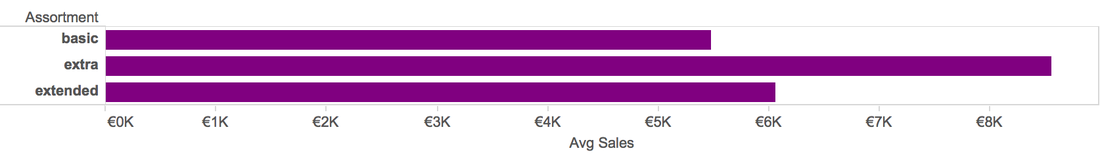
Q3: Which Store Assortment has the highest Sales
A3: Basic store has the highest total sales, but extra stores has the highest average sales. The same reason as store type. 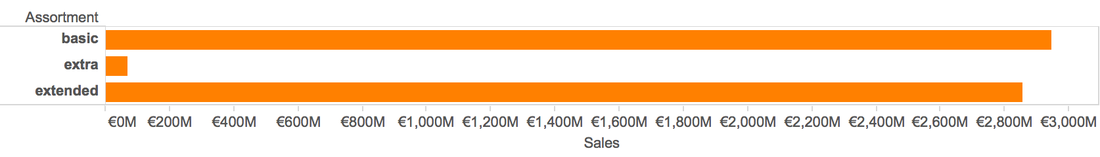
Q4: Is there a possible relation between competitor distance and the sales?
A4: When use scatterplot, we can analysis by trend line. When try linear trend line: 
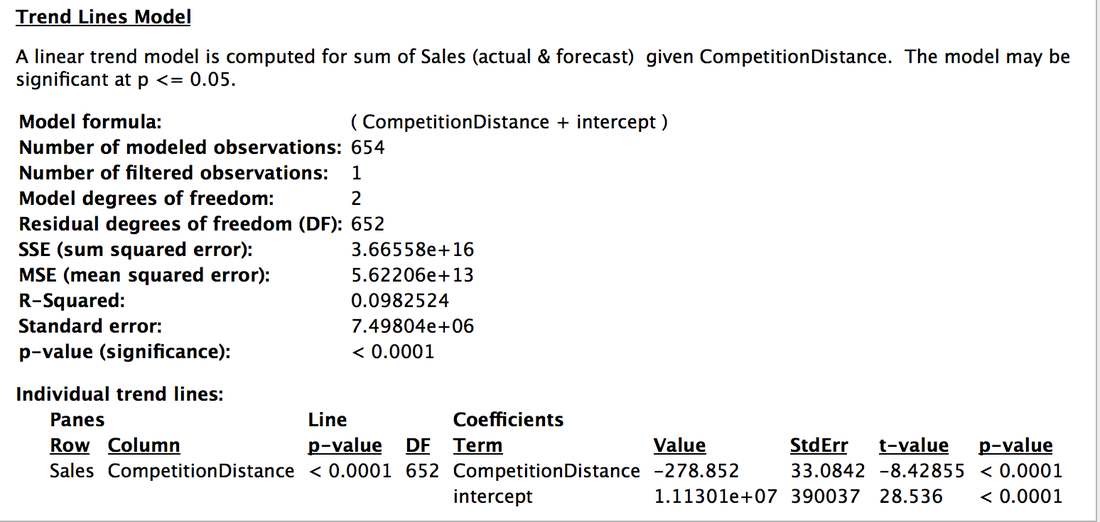
When try Logarithmic trend line:
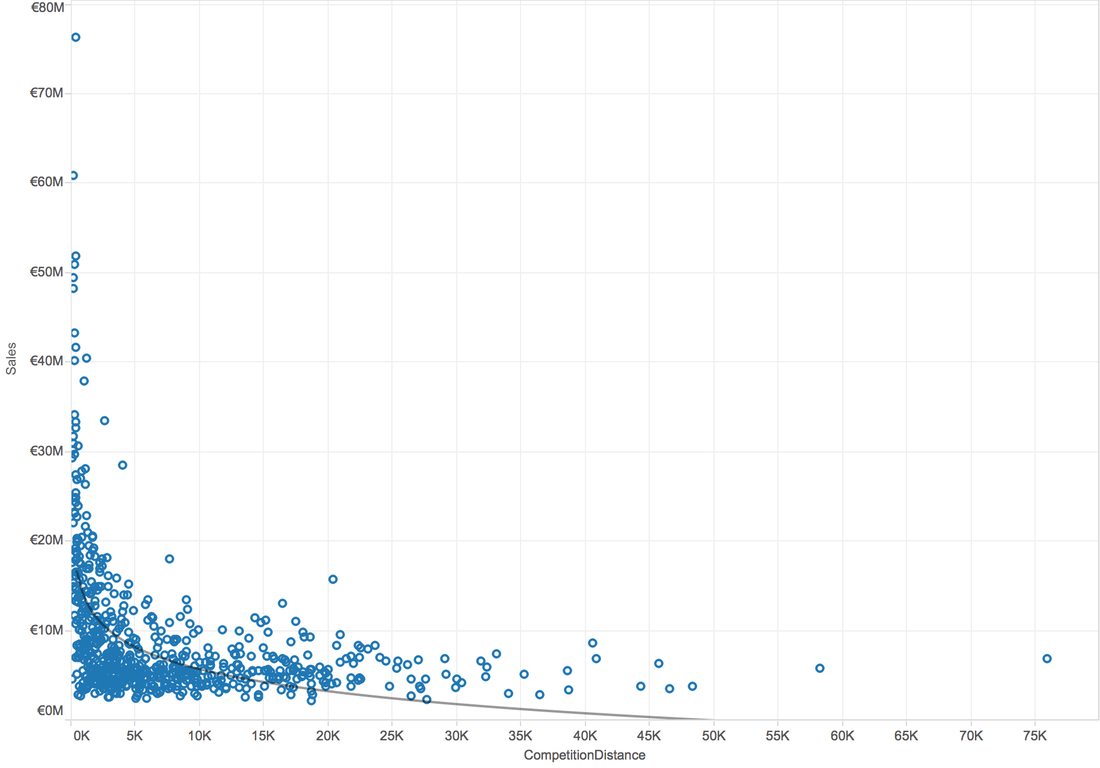
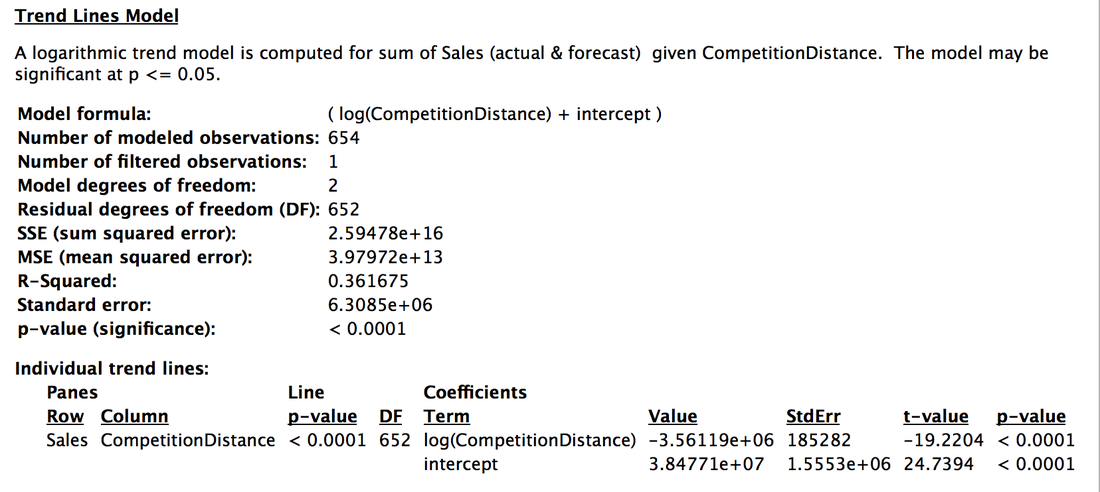
In general, higher R-Squared value means better model. So, there is a logarithmic relation between competition distance and sales.
Q5: Which Day of the week have higher sales? A5: The surprising is that people shopped much much more less on Sundays. 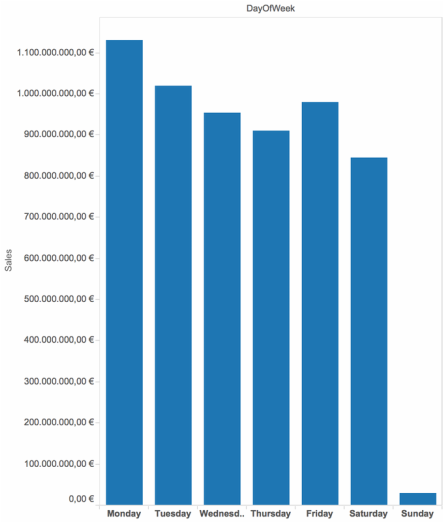
Q6: Did the Date Influence Sales?
A6: When aggregate data by week, the 51st week has higher sales than others. This might because in the end of a year, people need to buy some gifts for families or need to prepare for the new year, also the Christmas. 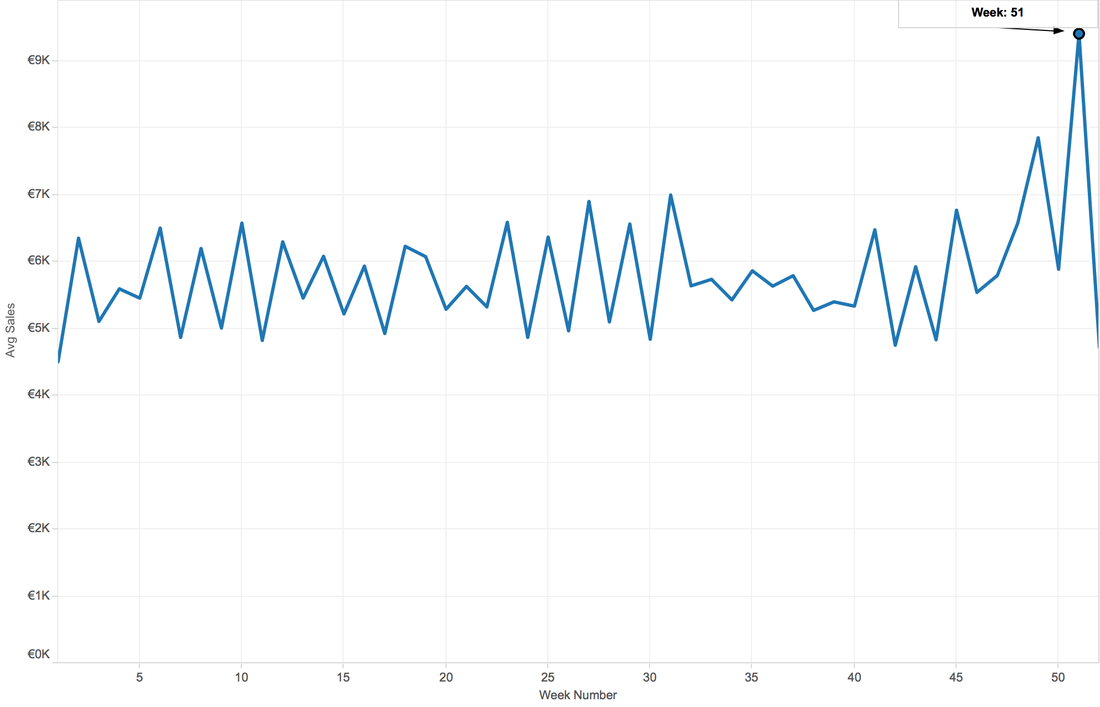
When Aggregate by Month, the first peak appears on Mar, second July, then December. My guess is, spring break, summer vacation and winter vacation, also the Christmas and new year.
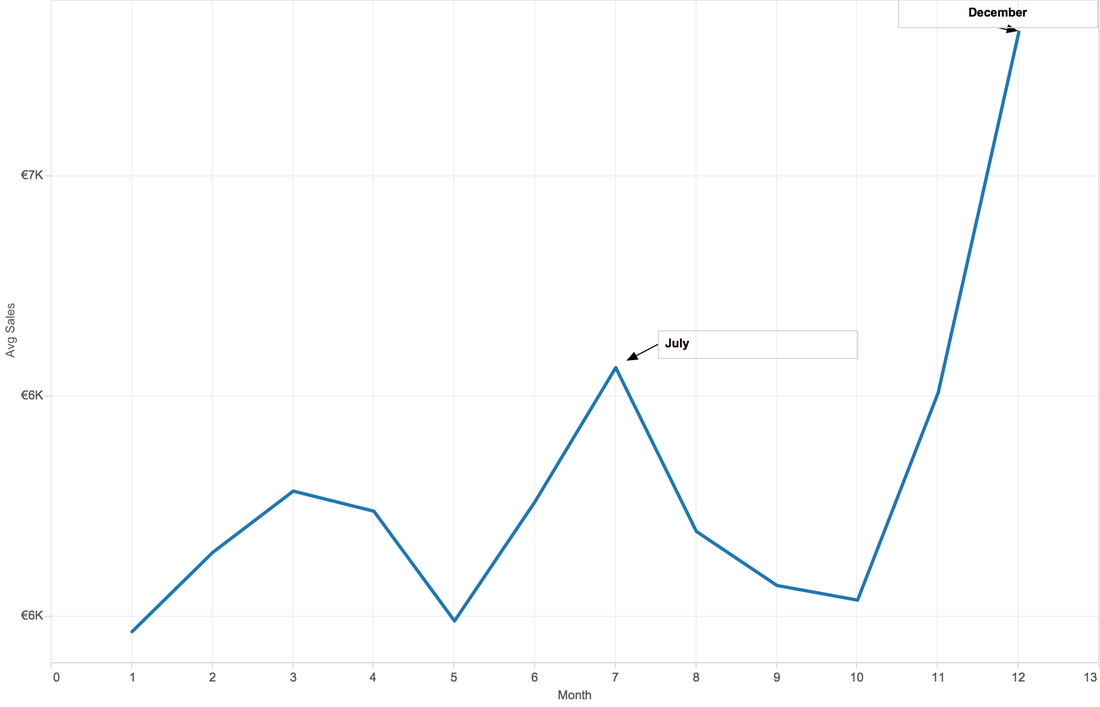
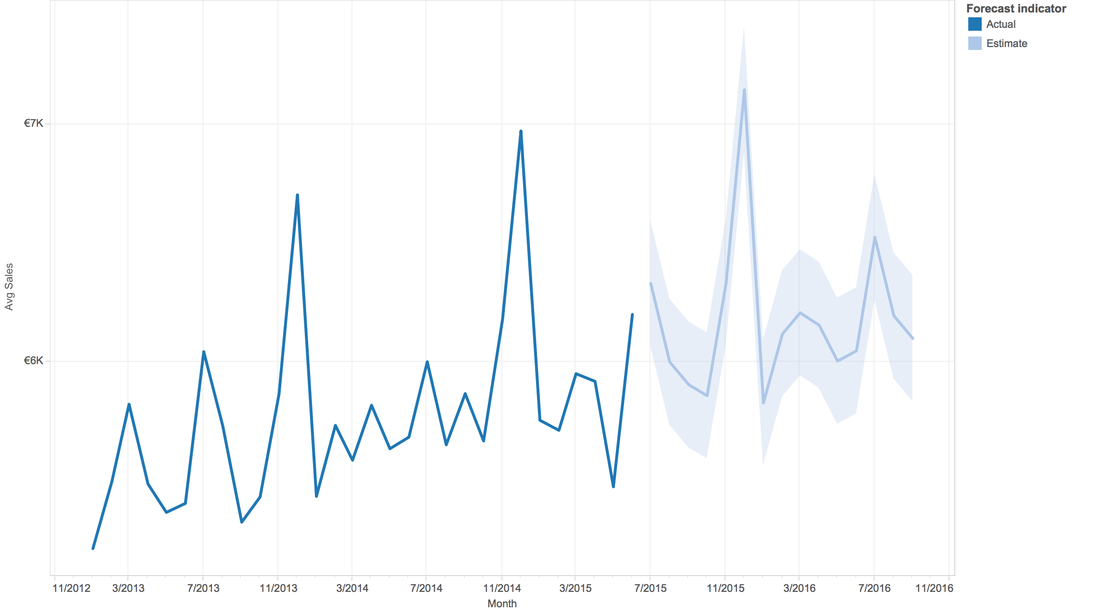
Tableau is clever. This software can do prediction, although we don't know the background algorithm.
Q7: Till now, we are curious about the sales, sales, and sales...anything else?
A7: How about the people's ability of consumption? We have total sales of a given day, we have customer numbers of a given day. So, can we create a new attribute, consumption ability = sales/customers. And, from the line graph, people's ability of consumption is increasing by year fluctuating in each year. 
In order to let you interactive with the dataset, here is a dashboard:
https://public.tableau.com/views/RossmannStoreSales/Dashboard1?:embed=y&:display_count=yes
0 Comments
|
Archive
February 2017
Category |
 RSS Feed
