|
Tableau 10 was released several weeks ago. The 10 version has more functions like cross-database join and cluster algorithm model. And I believe that San Francisco Crime Dataset is a good dataset to start. San Francisco Crime Dataset was released on Kaggle competition and you can download data here: https://www.kaggle.com/c/sf-crime/data?test.csv.zip This competition was designed to predict the category of crimes that occurred in the city by the bay. Here is the description of this competition: "From 1934 to 1963, San Francisco was infamous for housing some of the world's most notorious criminals on the inescapable island of Alcatraz. Today, the city is known more for its tech scene than its criminal past. But, with rising wealth inequality, housing shortages, and a proliferation of expensive digital toys riding BART to work, there is no scarcity of crime in the city by the bay. From Sunset to SOMA, and Marina to Excelsior, this competition's dataset provides nearly 12 years of crime reports from across all of San Francisco's neighborhoods. Given time and location, you must predict the category of crime that occurred." First, let's look at several lines of this dataset: 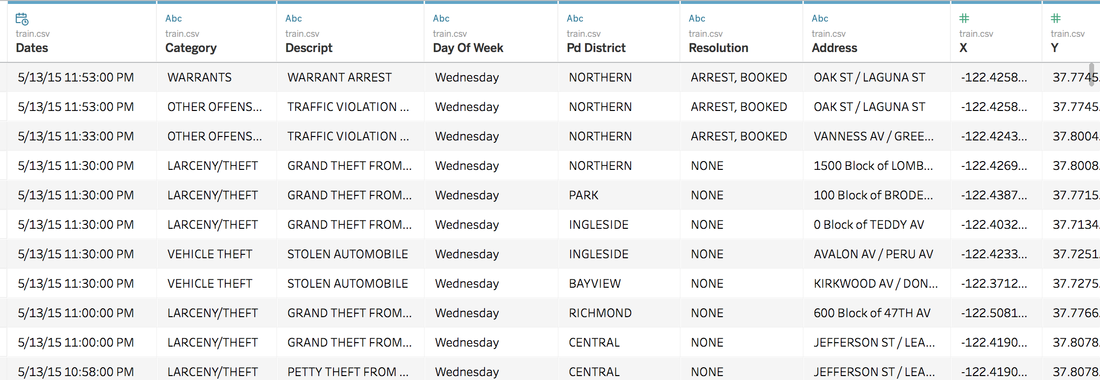 There are 9 variables in the dataset: Dates: timestamp of the crime incident Category: category of the crime incident Descript: detailed description of the crime incident Day Of Week: the day of the week Pd District: name of the Police Department District Resolution: how the crime incident was resolved Address: the approximate street address of the crime incident X: Longitude Y: Latitude 1. Time Series of Crime Records 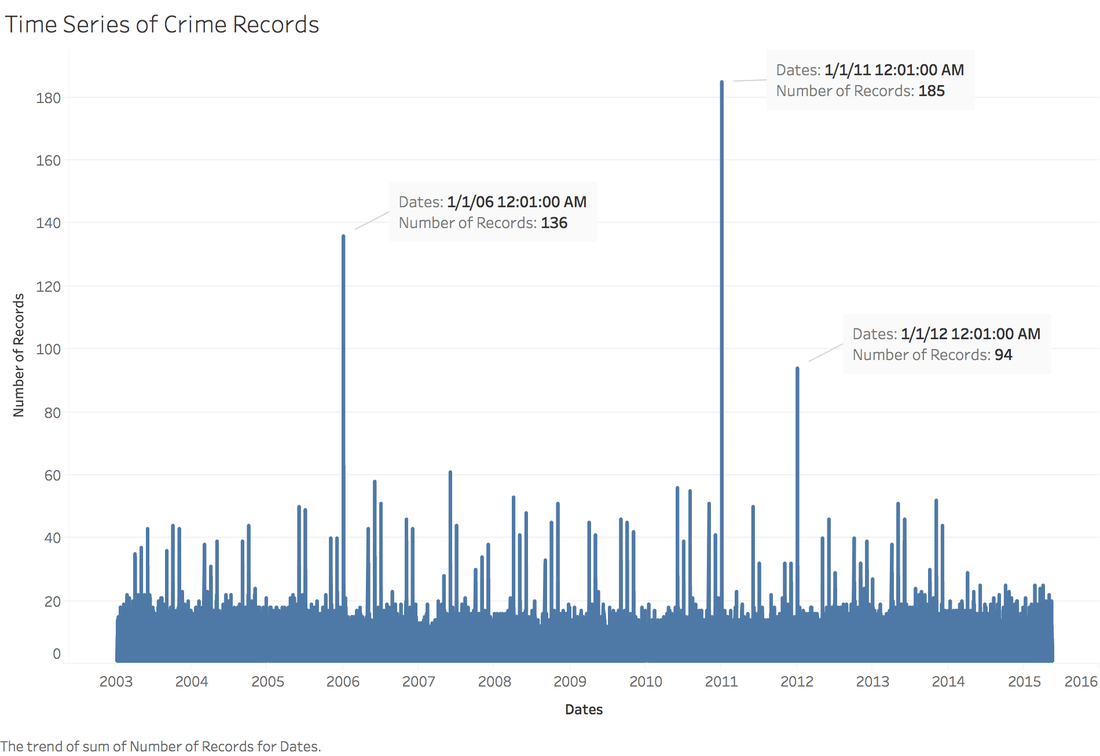 It is interesting to find that the top three peaks are all at the first day of 2006, 2011 and 2012. Which need more thinking is that most of other small peaks from 20 to 60 are always the first day of a month. When sum the crime records for each day of month: 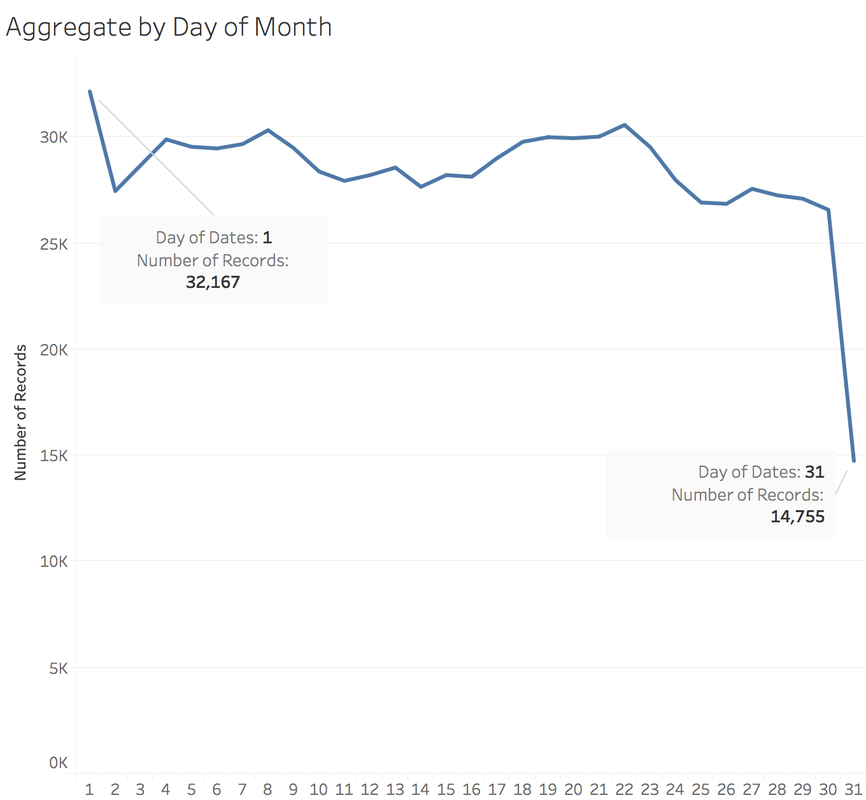 It is easy to understand that the sum of crime records of 31th is almost half of 1st, because not every month has 31th. Let's pick out the records in 1st and check the categories. 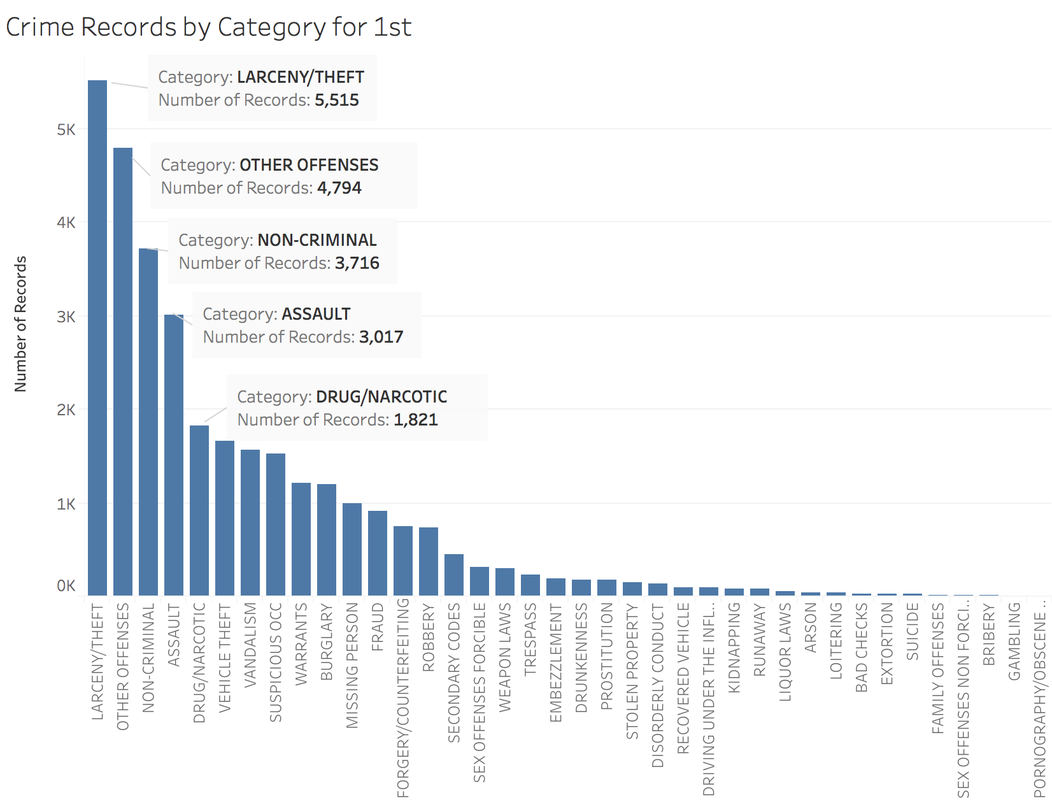 The top 5 categories of crime incidents are LARCENY/THEFT, OTHER OFFENSES, NON-CRIMINAL, ASSAULT and DRUG/NARCOTIC. 2. Where did crime happen? With x and y variable in dataset, we can map the data. 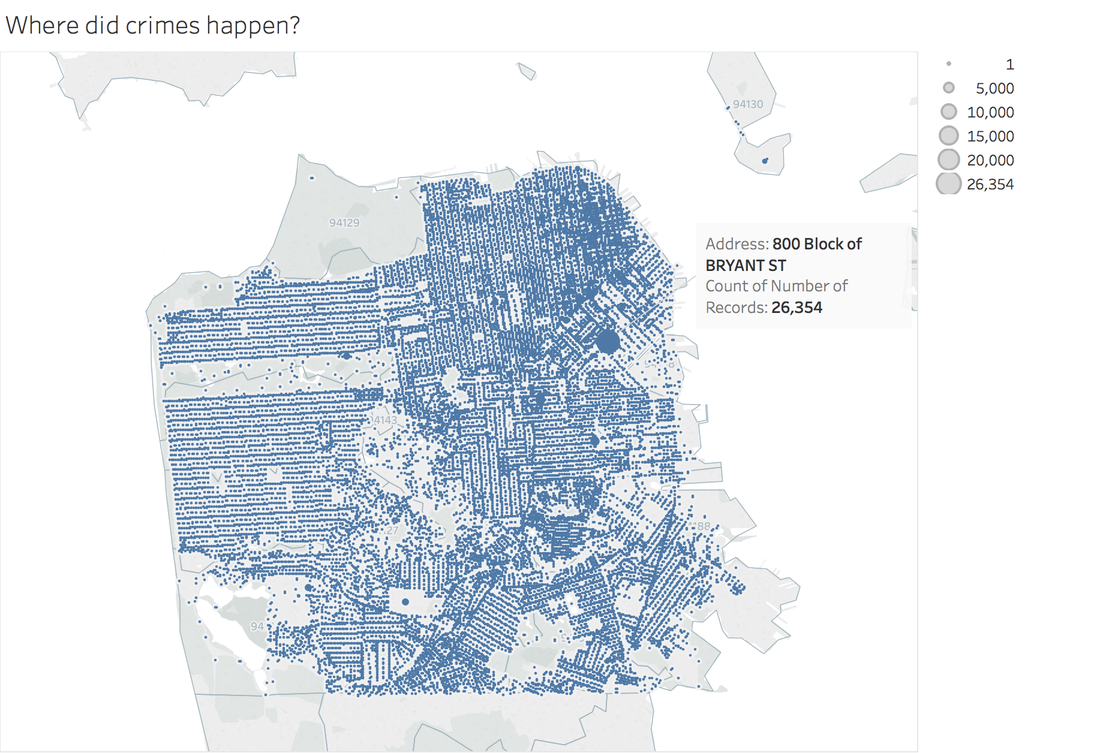 It is very clear and interesting to see the places of crime happened follow the streets pattern. I use records to size of circle and find that 800 Block of Bryant St. is a place that has 26,354 crime incidents during 2003 to 2015. Then remove the spots that have less than 1000 crimes during 12 years. 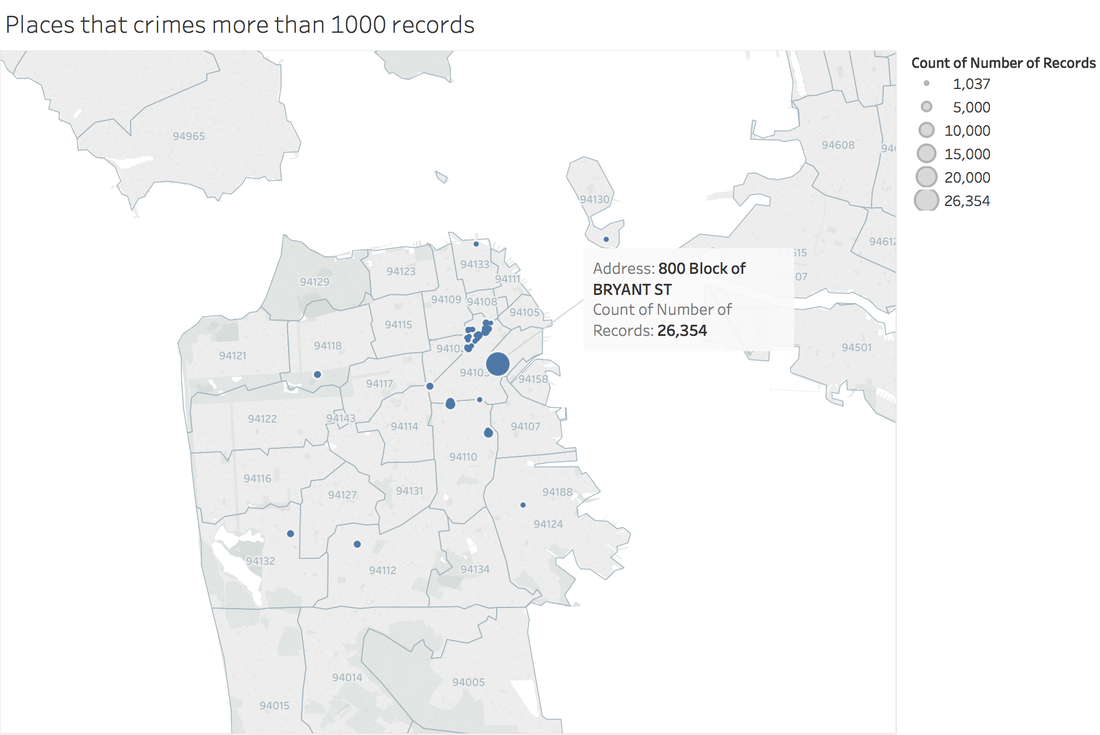 Can I conclude that the south east of San Francisco Bay Area is more dangerous? Then let's see the category of crimes for 800 Block of BRYANT ST. 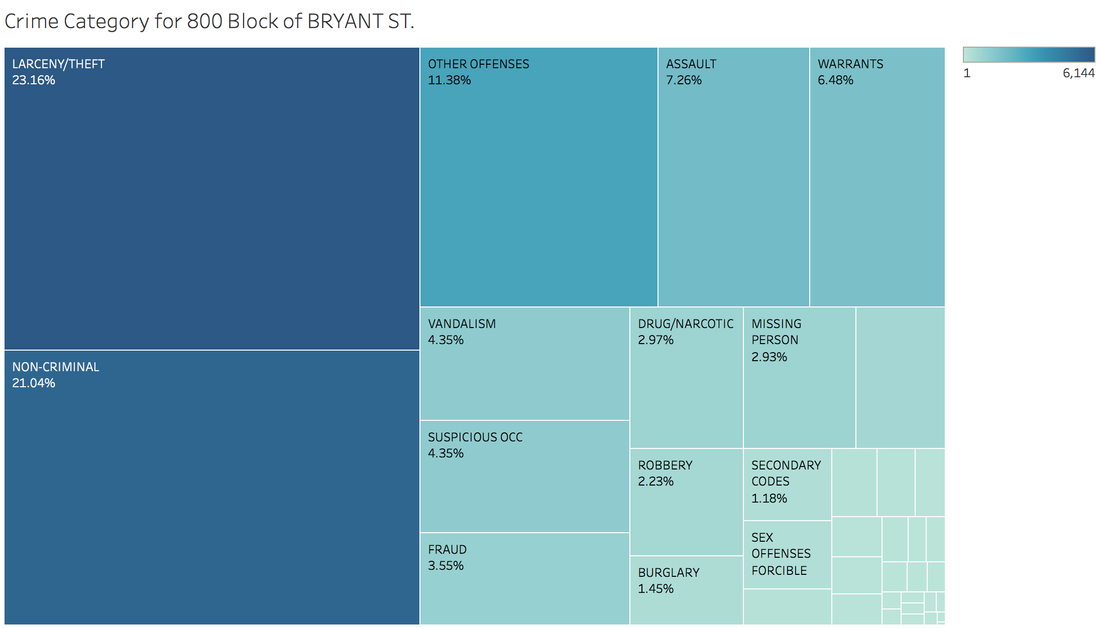 When adding the Police Department Districts to map: 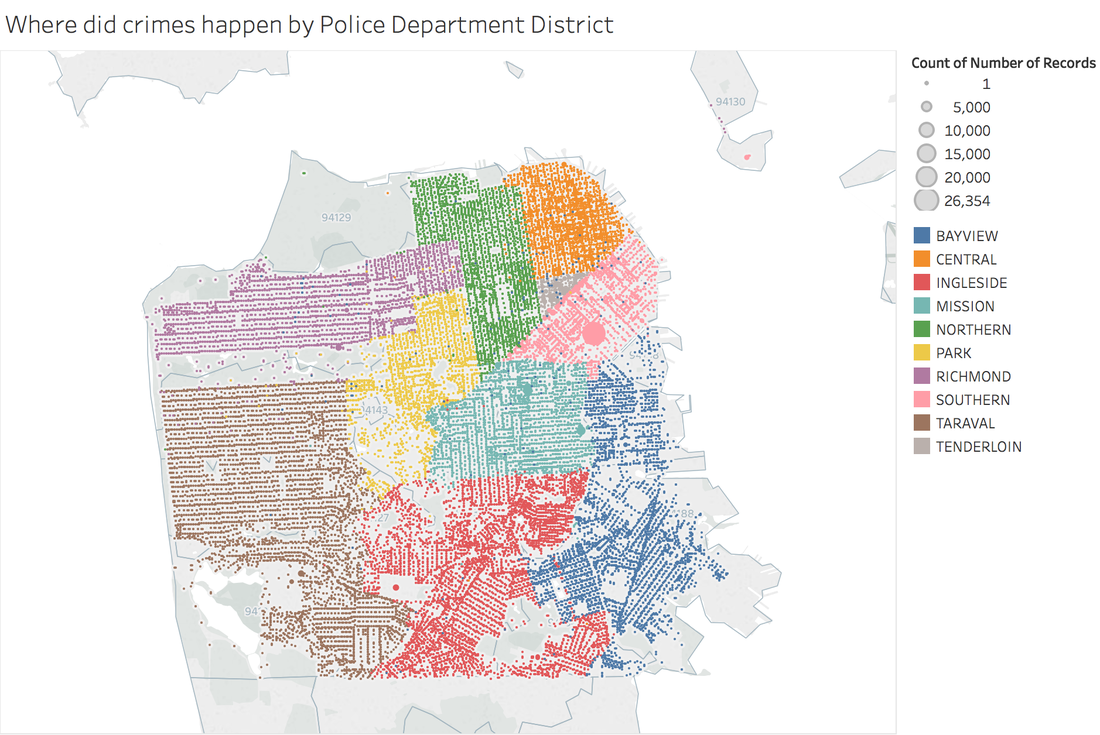 3. How did crime incidents resolved? 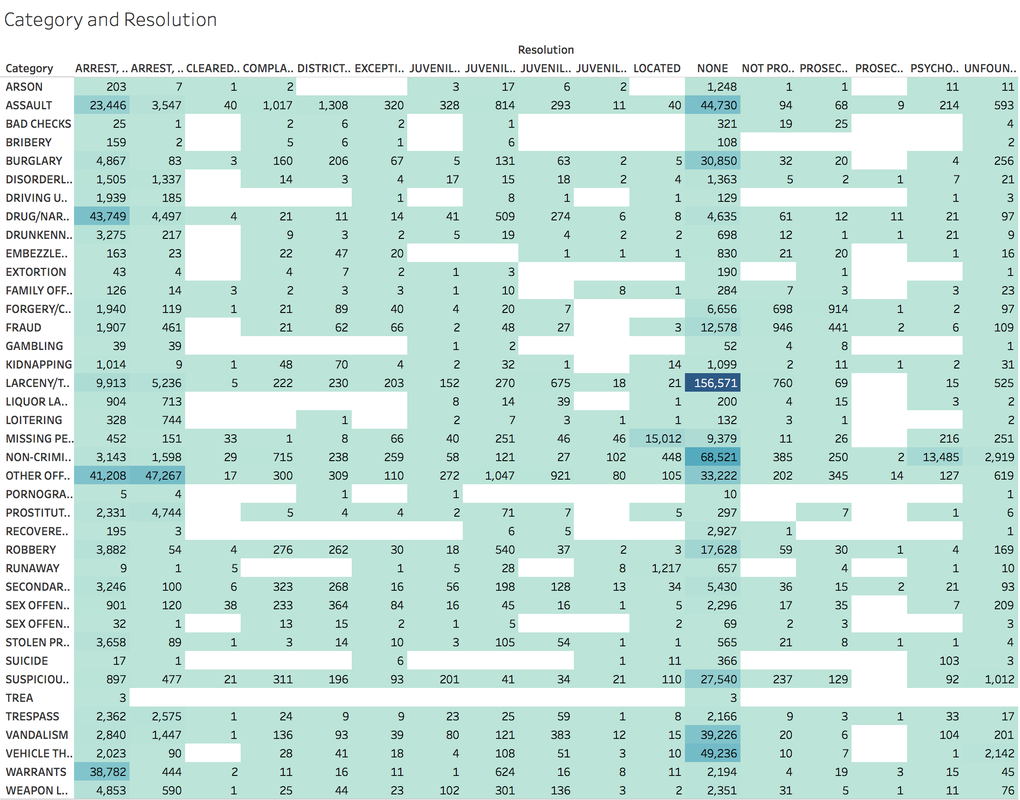 Other than ARREST resolution, most of the crime incidents were under the NONE resolution, which is understandable and disappointed. 4. Create a dashborad 
0 Comments
|
Archive
February 2017
Category |
 RSS Feed
